Sociology's Hiring Network
August 12, 2025
To celebrate the end of the ASA annual meeting, with its anxious networking and job seeking (that will be me next year), I decided to make a plot of the hiring network in sociology. I used data from this fantastic paper by Hunter Wapman and his colleagues. It contains all tenured or tenure-track faculty at 368 PhD-granting institutions in the United States who were working at any time between 2011 and 2020. This includes all fields, but here I used only the data for sociology departments. The data comes as a hiring network: each faculty is an edge, with the department where they obtained their PhD as the origin and the department where they currently are employed as the endpoint. The departments are ranked by status using the Spring Rank algorithm. In the words of the authors:
Treating the flows of faculty between US universities as a network leads to a natural, recursive definition of prestige: a department is prestigious if its graduates are hired by other prestigious departments.
What the algorithm does is minimize the number of hires from lower-ranked departments by recursively trying different arrangements.
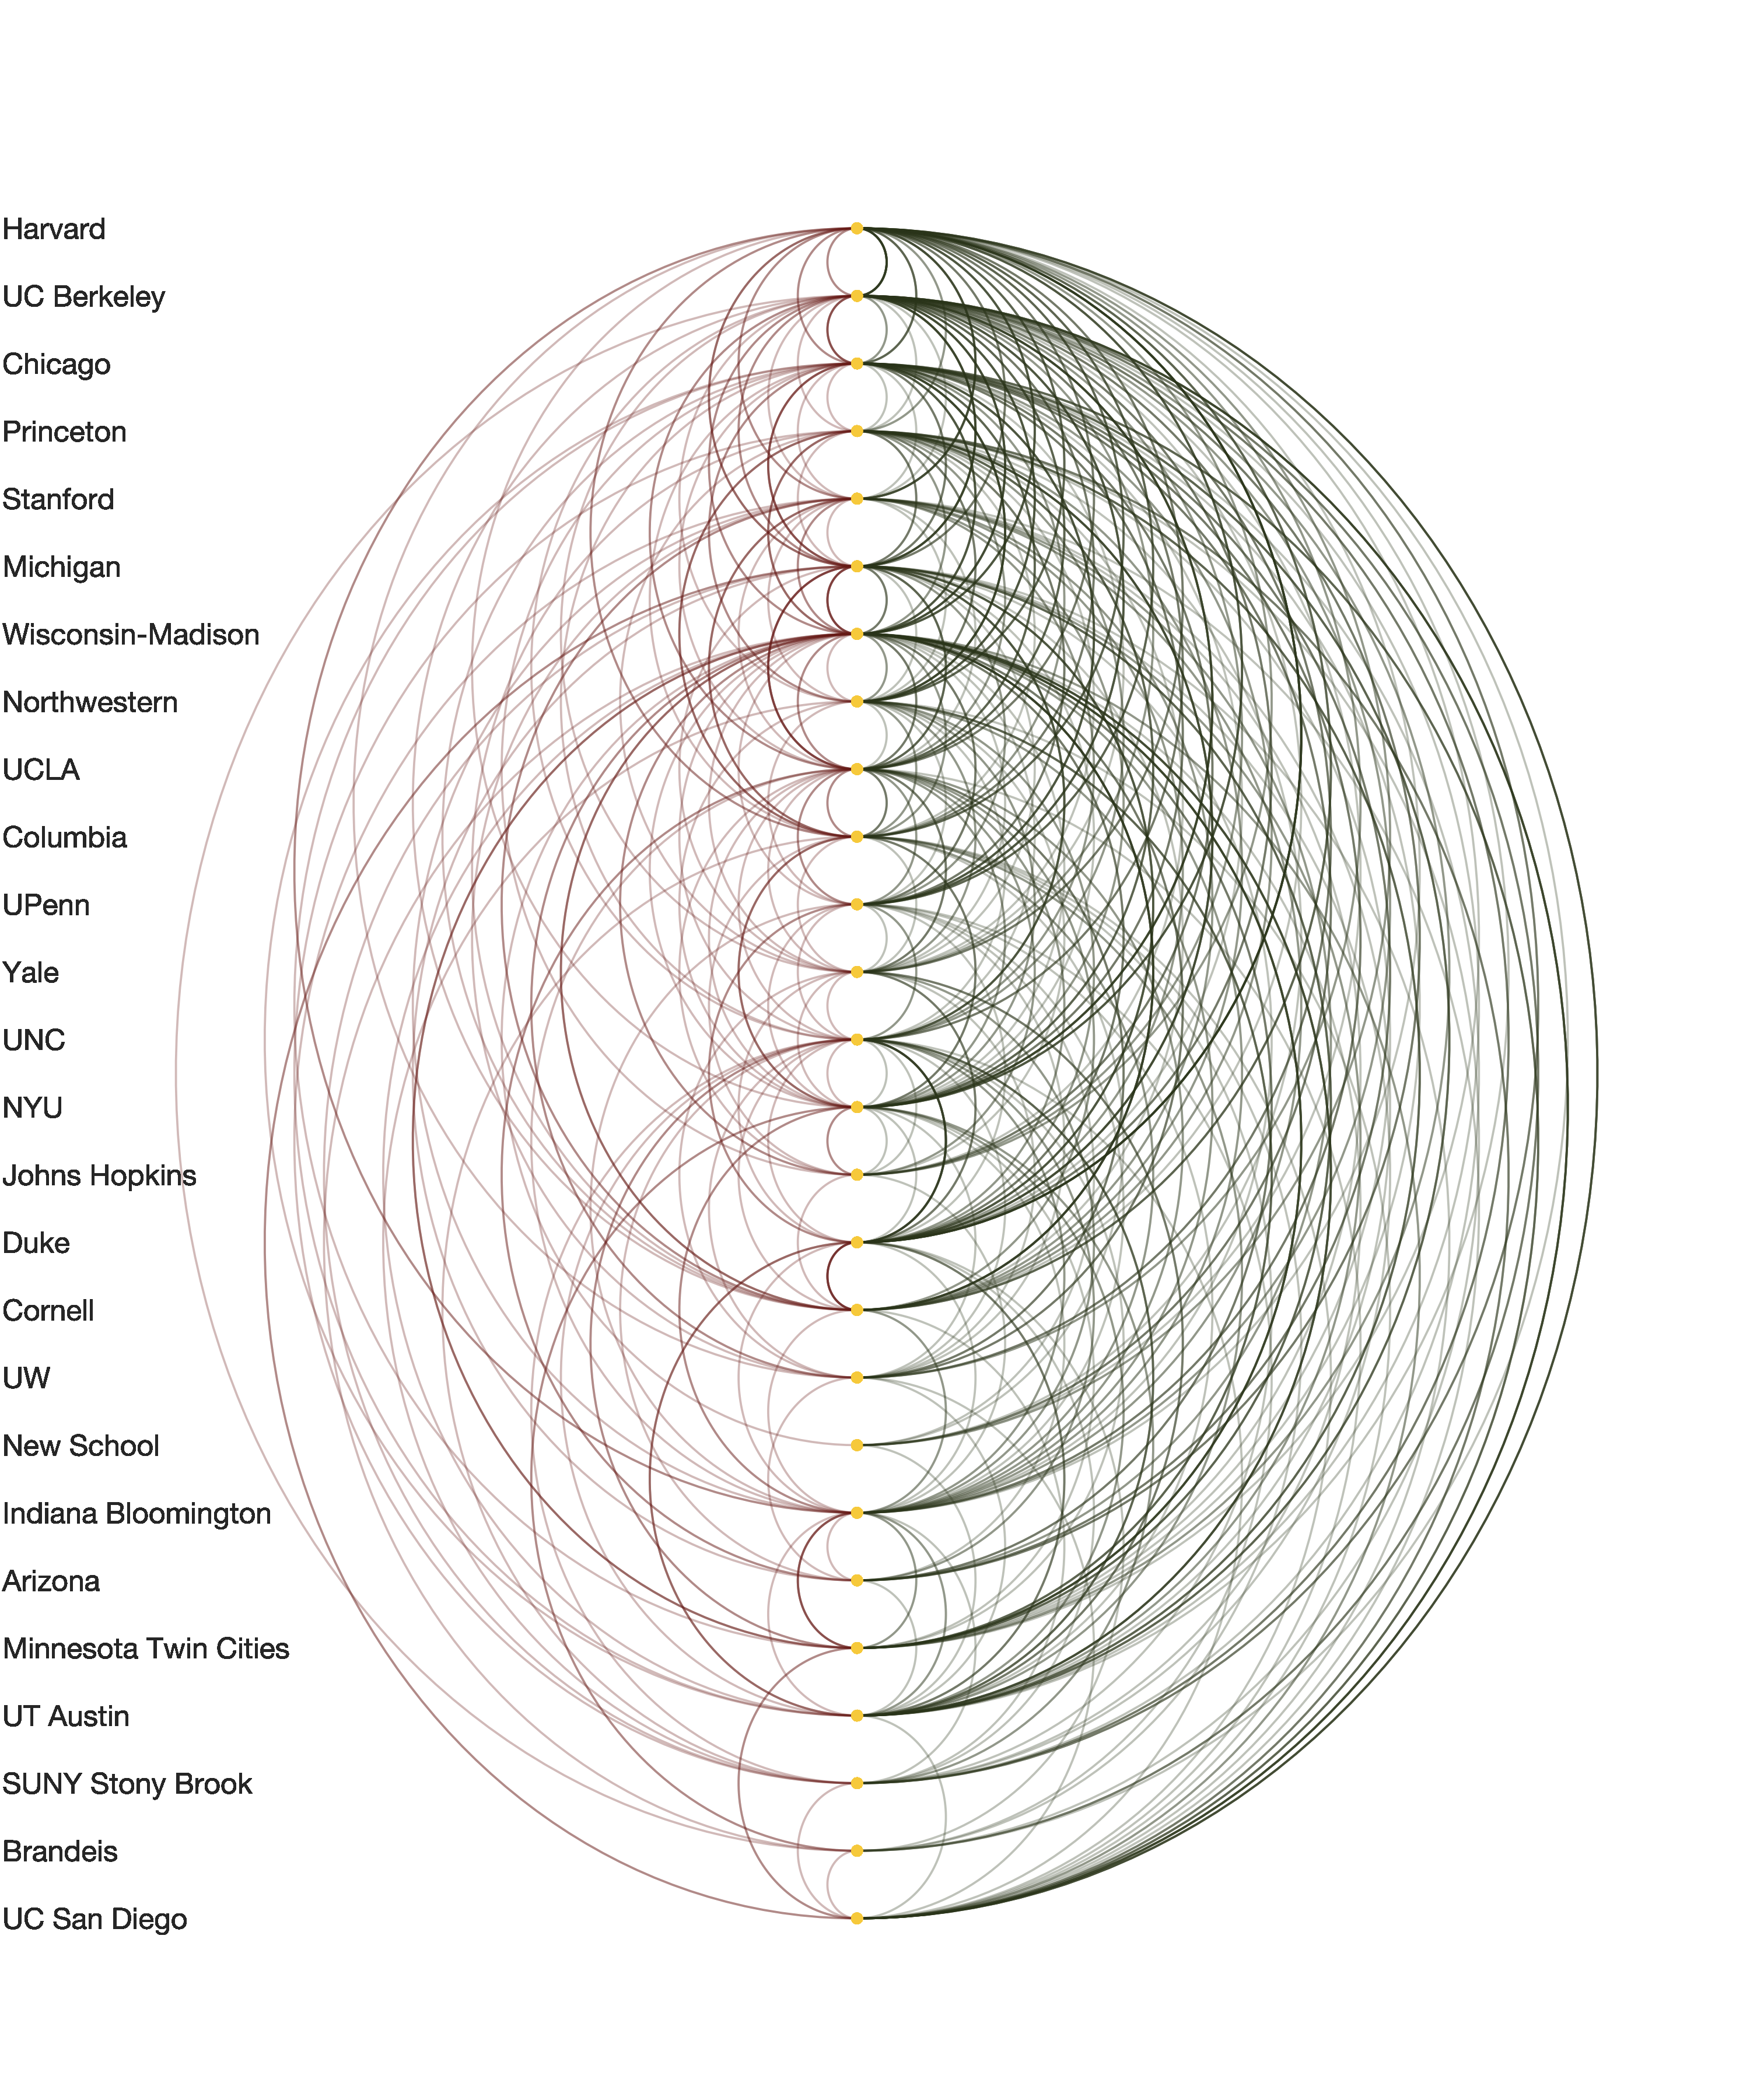
So here is what hiring looks like in sociology for the top 25 departments. The green lines are downward moves (PhD department is higher ranked than the department where someone is employed), and the red ones are upward moves. That there are fewer upward moves than downward moves is not surprising; this is exactly what the ranking algorithm seeks. But the ratio is not too bad, with one in every three moves flowing up the ranks. The hierarchy becomes steeper when considering all departments (not just the top 25). In that case, only about one in ten moves is upward. This is still more than in other fields, like economics, where only about one in twenty moves is upward. As the authors explain in the paper, a fair chunk of this inequality is explained by the differential production volume of PhDs. Although, especially in the social sciences, the upward moves are still much fewer than you'd expect given the PhD production alone. This is just to say that there is a status hierarchy in sociology, and it has consequences for your career. No surprises there.
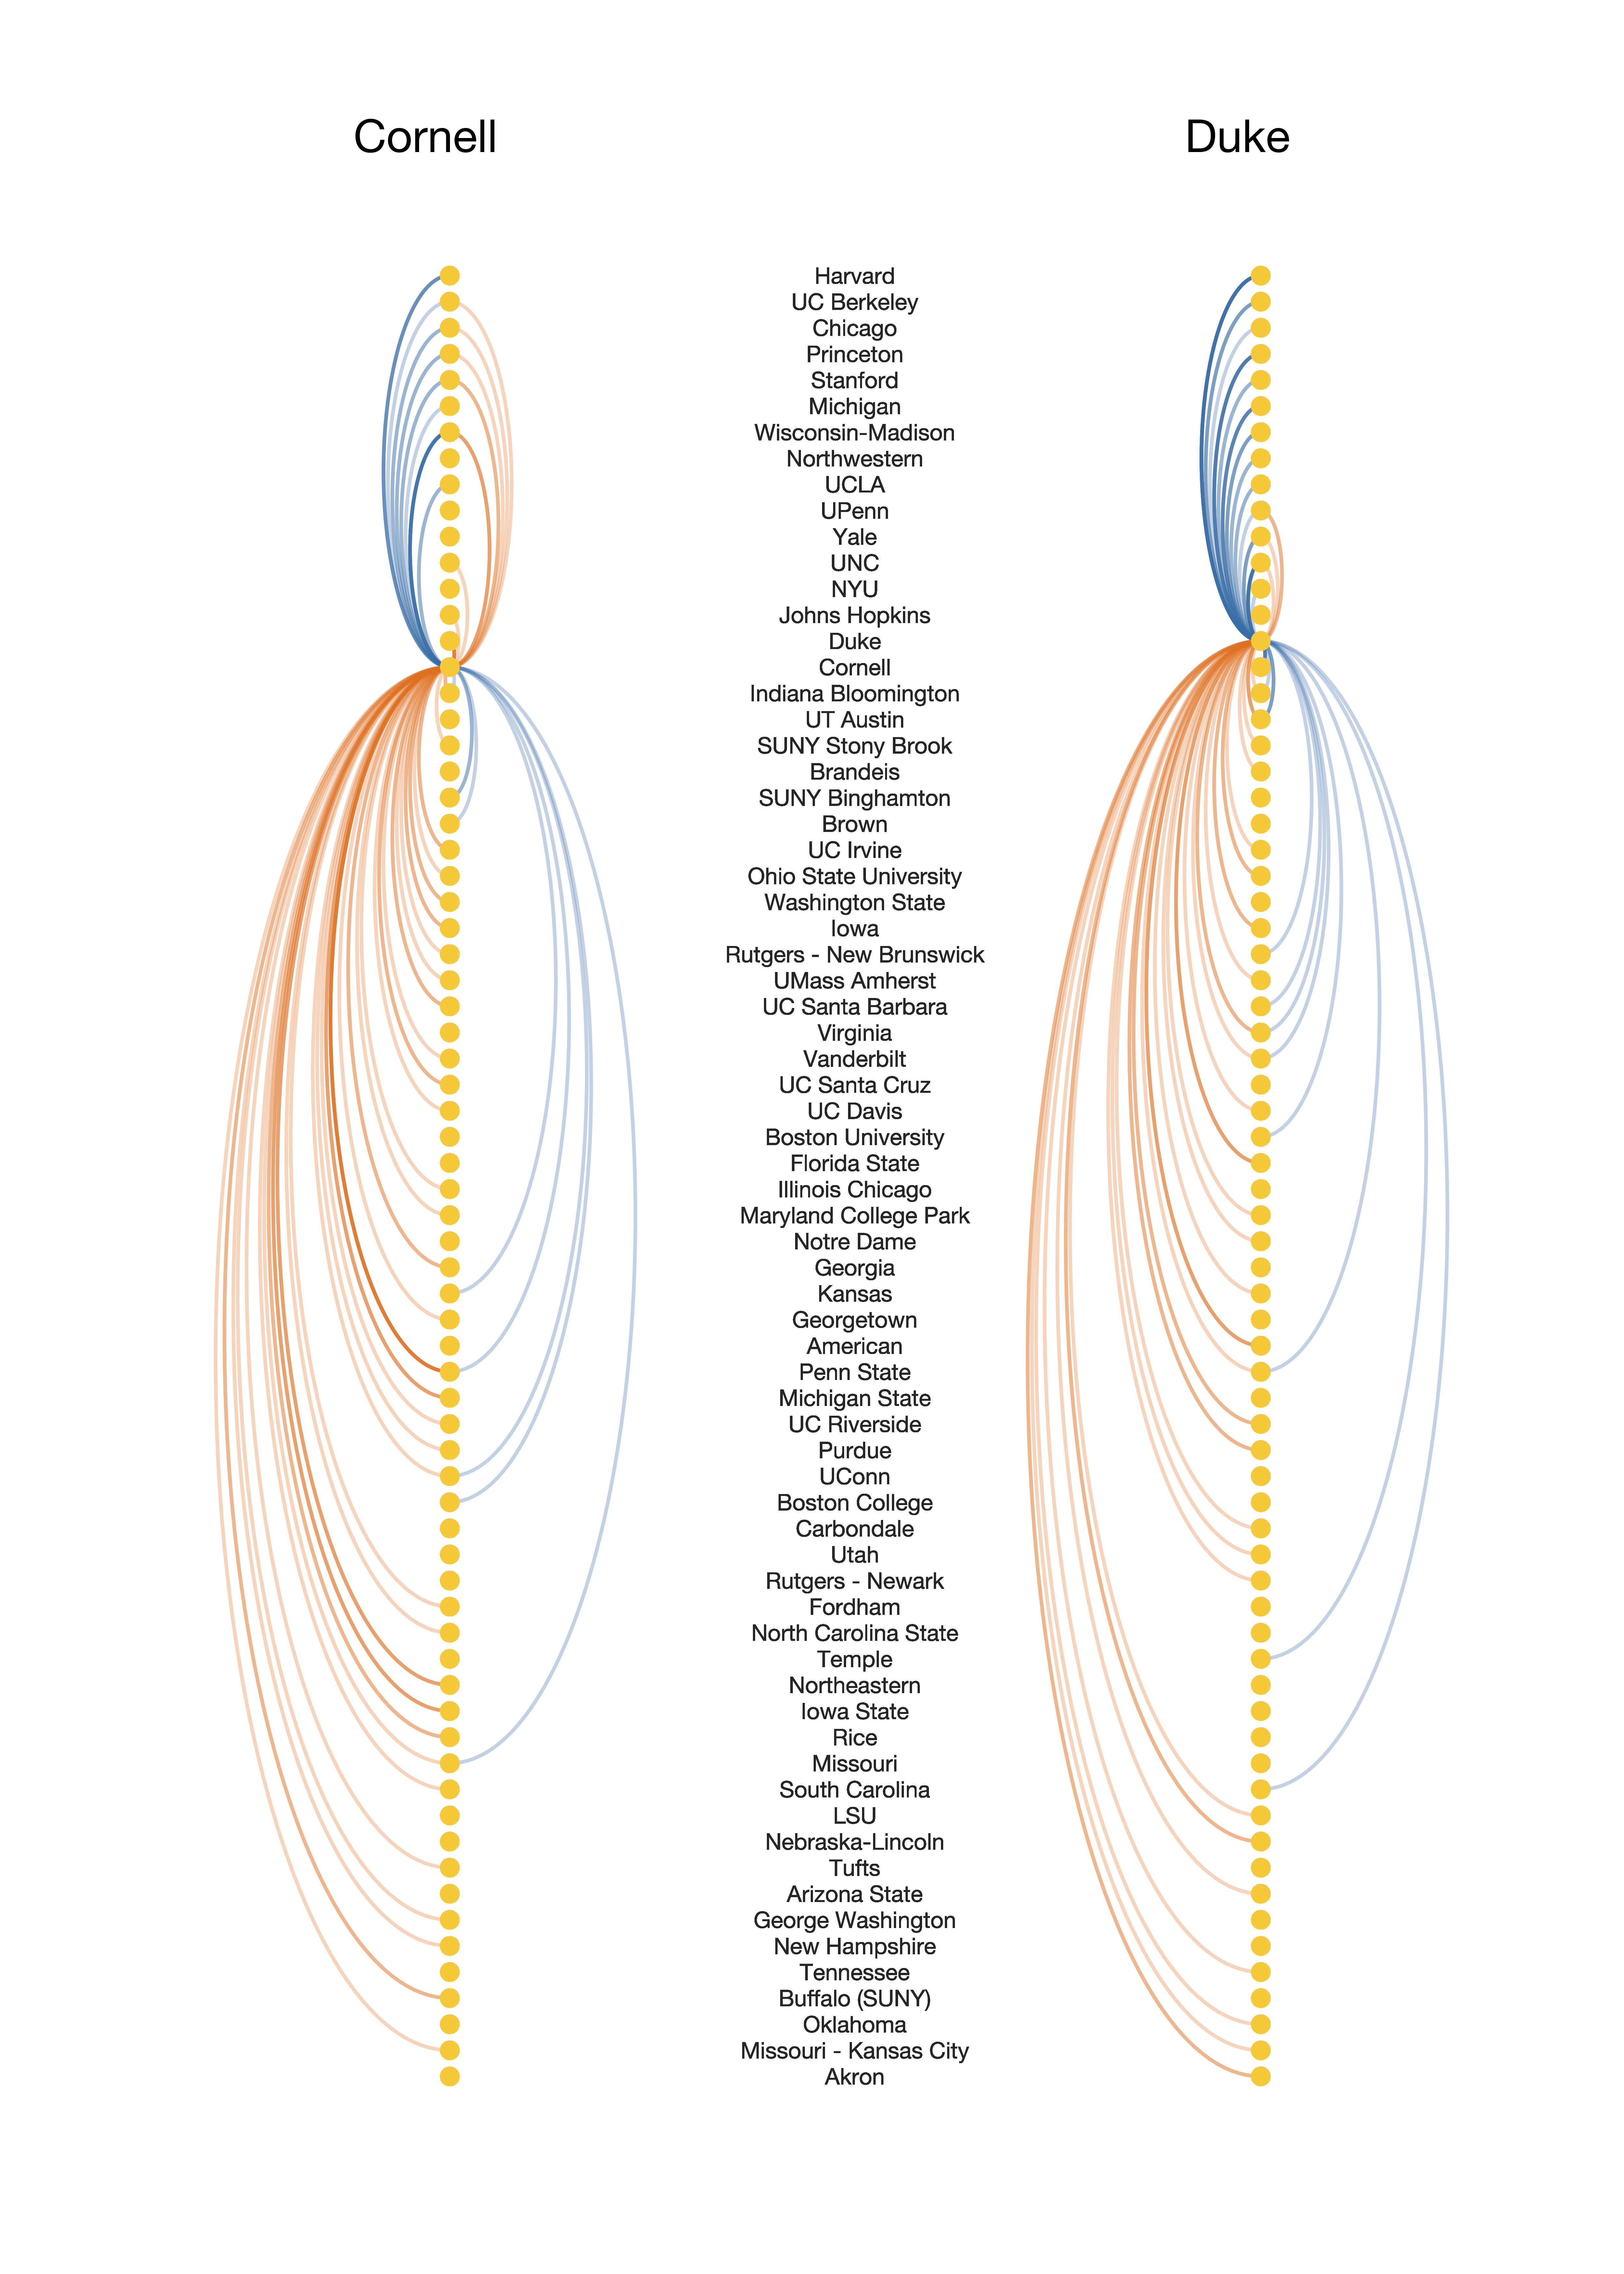
Another way to look at this data is by department. Here I show two departments that are adjacent in the ranks: Duke and Cornell. The edges in orange represent PhDs produced by these two departments, and the ones in blue represent where the faculty obtained their PhDs. The pattern is very similar (also to other departments in the mid ranks). Most faculty come from the top ten departments, and most students move to lower-ranked ones. Also, the average downward move length that students experience is longer than what their faculty experienced. What this suggests is that there is a natural mismatch between the experience of academia that the average faculty member and the average grad student within the same department have. This might help explain why some professors think that students use low career expectations as a kind of coping mechanism, as in this blog post.
It is also quite troubling interesting to see that Cornell has placed a few more students up the ranks than Duke has. This data, however, includes all faculty, so some of those moves might be decades old.